Synchrographics is a method to visualize and illustrate mathematical and scientific concepts. The first one deals with division and factors. Synchrographs convey detailed patterns in permutations, the partitioning function, prime numbers and many other areas.
Division and the structure of number
The division algorithm is fundamental and important details are shown in a series of synchrographs from simple to increasing complexity.
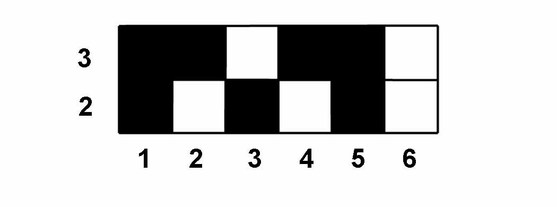
Each Row represents a divisor and each column represents a dividend. The occurrence of a white square in each row indicates even divisibility. This graph shows that 6 is the first number divisible by 2 and 3. We can also see that since every even number is divisible by two (2) the is a white square every two spaces in the 2 row. Since every third number is evenly divisible by three (3) there is a white square every three spaces in the 3 row.
The property of being divisible by consecutive numbers starting from 2 creates a unique set of numbers with special properties. They are not only a subset of what mathematicians call "highly composite numbers" they have a unique structural property and symmetry which is clearly revealed using synchrographics and are referred to as "omnits". Note the symmetrical reflective pattern of white squares where the half way number 3 is the mirror.
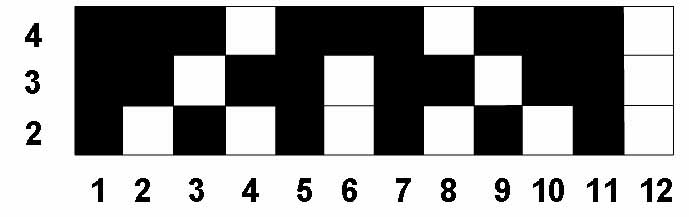
The next omnit is 12 which is evenly divisible by the consecutive divisors 2-4. Notice the reflective pattern mirroring at the half way number of 6.
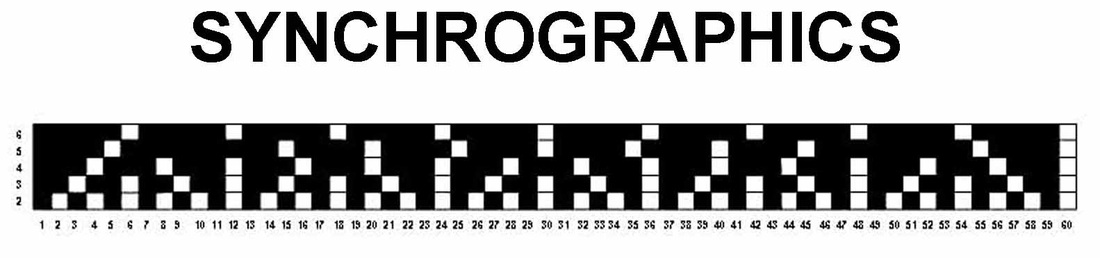
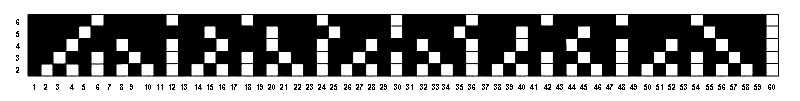
The next omnit is 60 which is divisible by the consecutive numbers 2-6. Again a perfect reflective pattern of white squares is revealed mirroring at the half way number of 30. These symmetric patterns clearly show that numbers have inherent structure.
The next omnit captures 7 as a divisor and is 420. To capture 8 an additional factor of 2 is needed and 840 is the next omnit. To capture 9 means an additional factor of 3 is needed, and with 10 already a factor the first number divisible by 2-10 is 2520. Since trying to graph this in linear form would make the graph far to long to fit on the page imagine the 9 tracks 2-10 are wrapped into a 7 banded spiral with 360 divisions each, totaling 2520.
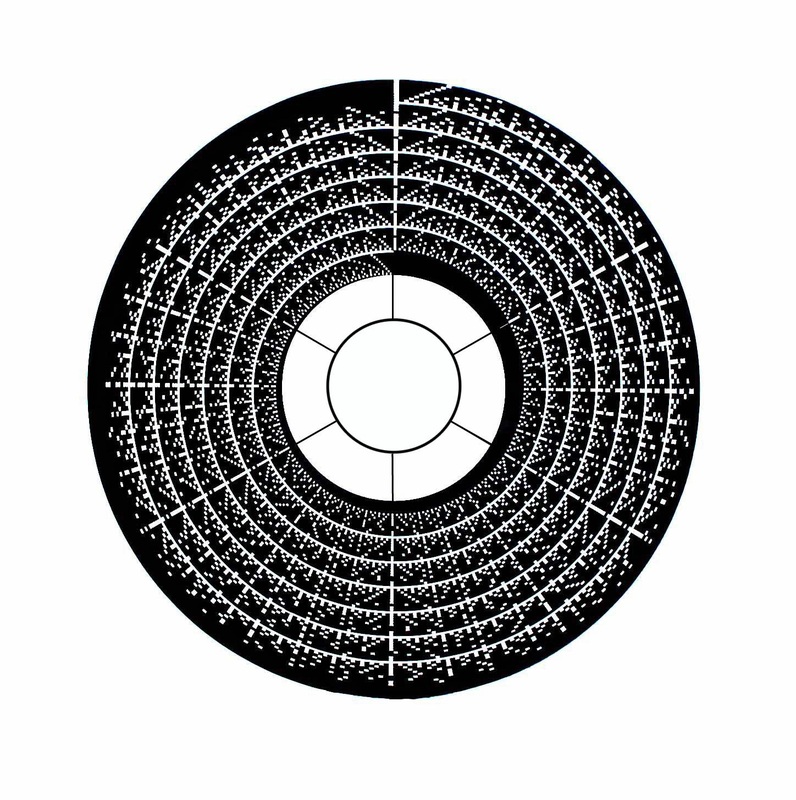
 1260 is the halfway location to 2520 and like previous ominits mirrors the preceding pattern of white squares in reverse.
The same reflective symmetry occurs within the 2520 synchrograph at the half way number of 1260. In addition by spiraling the graph various radial axis occur aligning highly composite numbers. More details about this are explained elsewhere.
Further examples of synchrographs
Modulo Function
A further extension of the previous synchrograph is the modulo function. By employing colors more information can be conveyed in a given amount of space.
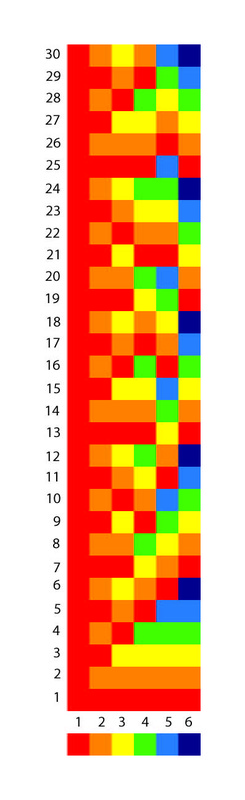
The modulo function synchrograph shows if a number is evenly divisible by a given divisor. If not the graph indicates the remainder or modulo. The vertical column of numbers represent the dividends. The divisors are indicated at the base of the graph with color coding index. Each column is designated a number and associated color.
For example 18 is evenly divisible by three (3) and there is a yellow (3) square next to 18 in the 3 (yellow) column. Take 24. It is not evenly divisible by 5 and results in a remainder of 4. Hence in the 5 column next to 24 there is a green
square. Per the color coding index green represents 4.
Alternatively since every number is evenly divisible by 1 the is a red square next to every divisor. Since every other number is evenly divisible by 2 there is an orange (2) square every other place in the 2 (orange) column. Since every third number is evenly divisible by 3 there is a yellow square every 3 spaces in the 3 (yellow) column and so on. While each column taken separately has simple repeating sequences of colors the graph as a whole shows increasingly complex permutations.
Extending the Modulo Function to Higher Iterations
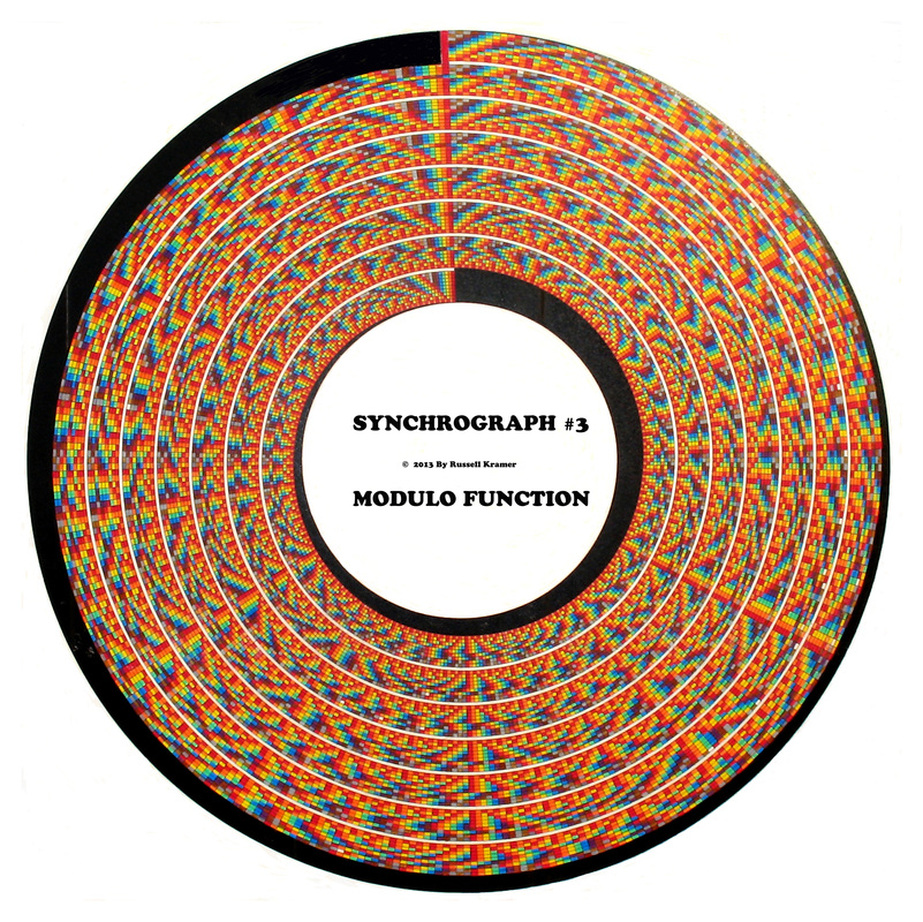
Here the modulo function graph is extended to 2521 which is the first number where all the modulo values of 2-10 all synchronize at the same value of 1. Note the 1 (solid red) track is absent from the spiral graph.
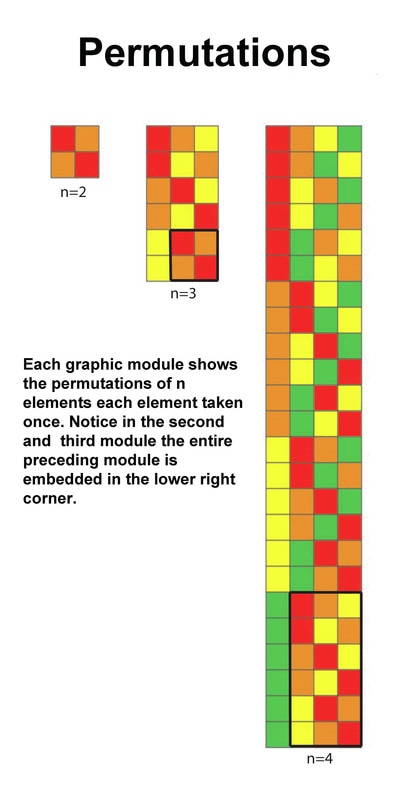
Permutations